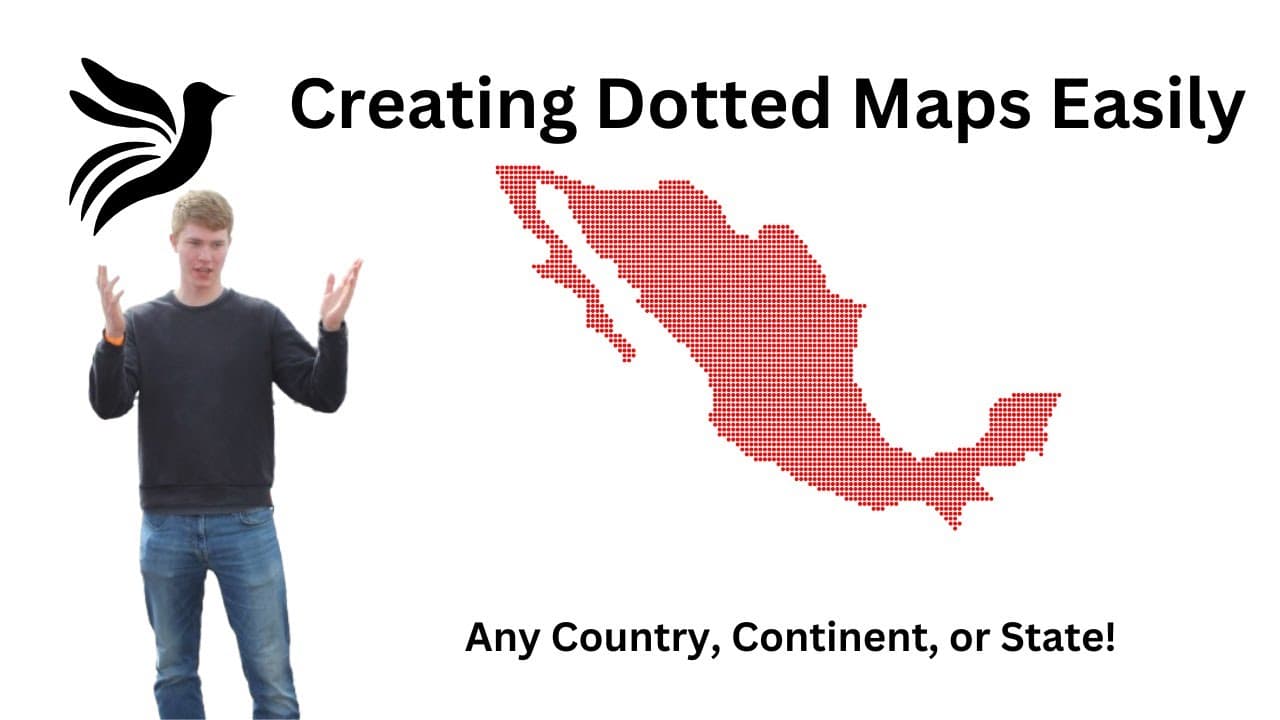
In today's digital age, maps have evolved far beyond simple navigation tools. They now serve as powerful storytelling devices, data visualizations, and engaging interactive elements on websites and presentations. SVGMAP is an open-source Python project designed to transform raw geographic data into beautifully rendered SVG maps, complete with customizable grid overlays. By leveraging Natural Earth's 1:110m Cultural Vectors, SVGMAP gives you the flexibility to showcase continents, countries, or states in a way that perfectly aligns with your creative vision.
Key Features and Capabilities
SVGMAP is built with versatility in mind, catering to both developers and creative professionals alike. Here are some of its standout features:
- Customizable Grid Overlays: Tailor the grid density to suit your visual style, from sparse layouts to densely packed displays.
- Adjustable Dot Colors: Whether you prefer traditional hues or bold, modern palettes, you can specify color names or hex codes to match your design.
- Broad Geographic Coverage: Easily generate maps for any continent, country, or state, making it ideal for a range of applications—from academic projects to dynamic web interfaces.
- Scalable Vector Graphics (SVG): Enjoy high-quality, infinitely scalable maps that maintain clarity and detail at any resolution.
What Can You Do with SVGMAP?
The applications for SVGMAP are as diverse as they are innovative. Here are some ideas to spark your creativity:
- Interactive Websites: Integrate dynamic maps into your site to visualize data trends or geographic distributions interactively.
- Data Presentations: Use detailed SVG maps in your presentations to highlight regional data, demographics, or market analyses.
- Educational Tools: Create custom maps for classroom settings to help students explore geography in a visually engaging manner.
- Creative Projects: Experiment with different styles and overlays to produce unique art pieces or infographics that stand out.
The Flexibility of Customization
One of the core strengths of SVGMAP lies in its ease of customization. Imagine being able to modify every aspect of your map with just a few lines of code:
- Dynamic Color Schemes: Adjust the dot colors to align with your branding or personal aesthetic.
- Variable Grid Density: Control the spacing of overlay dots to either emphasize fine details or present a broader, simplified view.
- Region-Specific Mapping: Simply input the name of a region—be it a country, state, or continent—and watch as SVGMAP brings it to life with precision.
This level of customization ensures that no two maps have to look the same, allowing your projects to remain as unique as your ideas.
The Benefits of Open Source
Being open source, SVGMAP not only invites collaboration but also offers transparency and continuous improvement from a vibrant community of contributors. Here's why that matters:
- Community-Driven Enhancements: Open source projects thrive on community input, ensuring that SVGMAP stays up-to-date with new features and optimizations.
- Learning and Innovation: For aspiring developers, contributing to or modifying an open-source project is a fantastic way to learn and innovate.
- Free and Accessible: SVGMAP is available for anyone to use, modify, and distribute, making advanced mapping technology accessible to a wider audience without licensing restrictions.
How to Install SVGMAP
Ready to dive in and start creating your own SVG maps? Getting started with SVGMAP is straightforward. For detailed installation instructions and to get the project running on your system, visit the GitHub repository:
SVGMAP GitHub Repository
Conclusion: Mapping a World of Possibilities
SVGMAP is more than just a mapping tool—it's a gateway to endless creative and analytical possibilities. With its customizable features, user-friendly design, and open-source foundation, SVGMAP empowers you to transform geographic data into engaging visual narratives. Whether you're building an interactive website, crafting an educational tool, or developing a unique data visualization, SVGMAP provides the flexibility and precision you need to bring your ideas to life.
Explore, experiment, and share your creations. The world of mapping is at your fingertips. Happy mapping!

Colin Lawless
Founder & Developer
Happy to answer any questions at colin@blackjay.io or via telephone at (603) 805-0919.
